Metrics
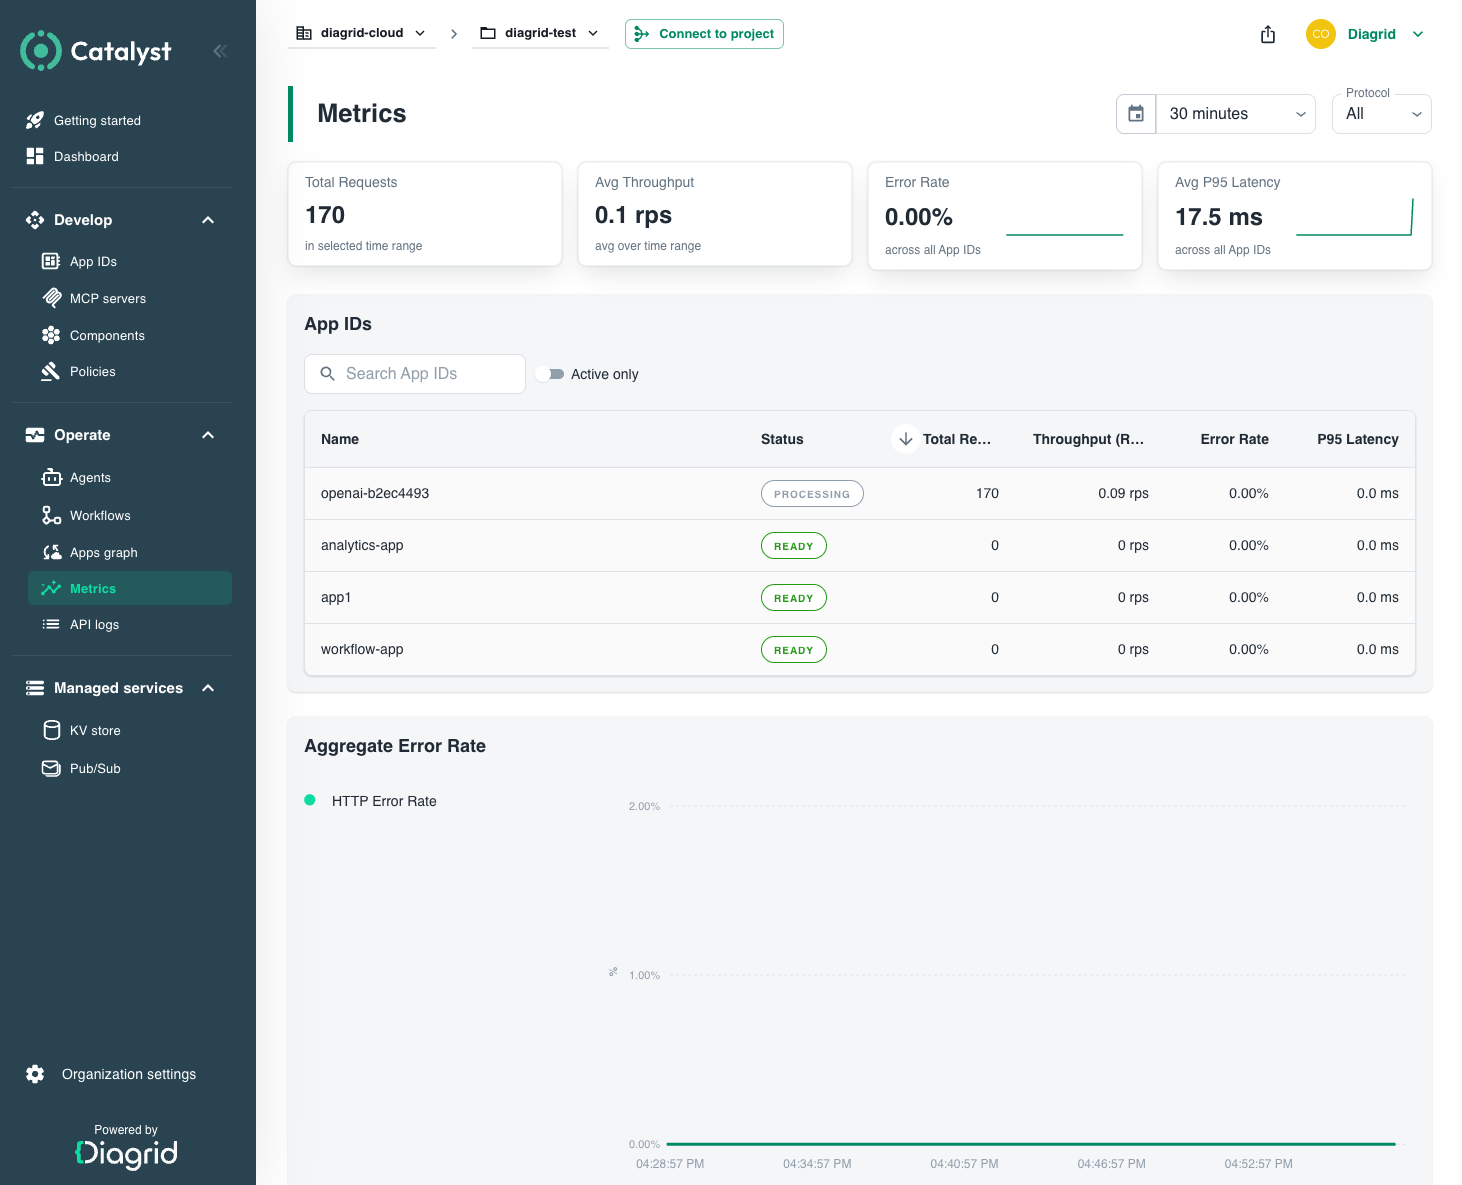
The Metrics page in the Catalyst console gives platform engineers and business operators a live view of request volume, error rate, and tail latency across a project — answering "is traffic healthy right now, and which App ID needs attention?" without needing to install Prometheus or write a single query. For the conceptual model (metrics, traces, logs), see Observability.
Dashboard panels
The Metrics page opens scoped to the whole project. It groups data into three areas.
Project KPIs
Four cards summarise the selected time window:
| Card | What it measures | Question it answers |
|---|---|---|
| Total Requests | HTTP + gRPC requests received across every App ID | "How much traffic did my project handle?" |
| Avg Throughput | Requests per second (weighted across protocols) | "What's the steady-state load?" |
| Error Rate | Weighted percentage of failed HTTP + gRPC calls | "Are calls failing project-wide?" |
| Avg P95 Latency | Worst-of HTTP / gRPC 95th-percentile latency, in milliseconds | "Are tail latencies acceptable?" |
App ID comparison table
A row per App ID with Status, Total Requests, Throughput (RPS), Error Rate (%), and P95 Latency (ms). Sort or filter by App ID name and toggle Active Only to hide idle workloads. This is where you answer "is my App ID near its rate limit?" — compare the RPS column against the per-App-ID rate limit for your plan in Catalyst Cloud quotas (100 RPS HTTP and 100 RPS gRPC per App ID on the free tier).
Selecting a row opens the App ID detail view.
Aggregate charts
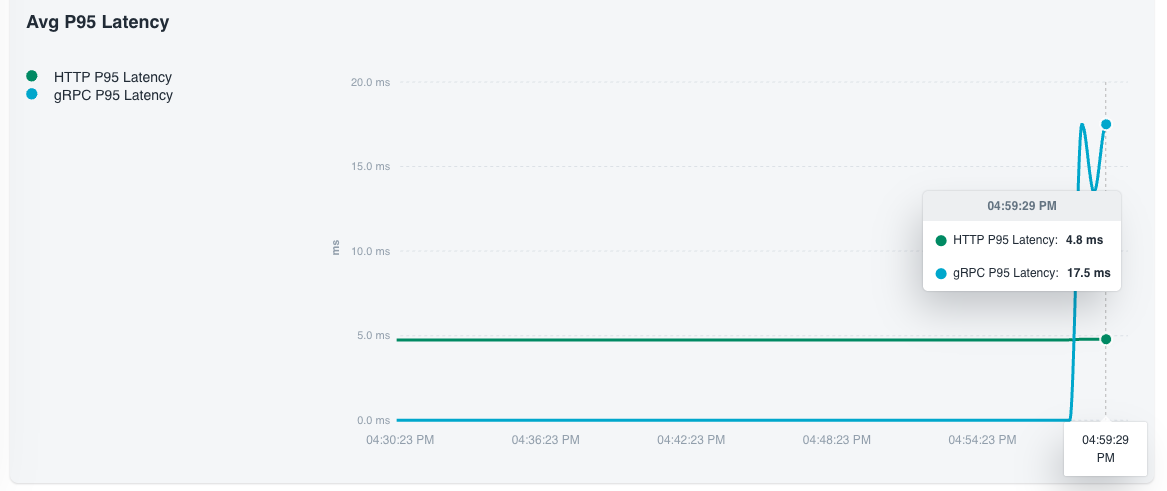
Two time-series charts for the project, split by protocol (HTTP / gRPC):
- Error Rate over time — pinpoints when failures started.
- P95 Latency over time — pinpoints when tail latency regressed. Hover any point to read the HTTP and gRPC values at that moment.
Filter and zoom
The toolbar applies to every panel on the page:
- Protocol —
All,HTTP, orgRPC. - Time range —
1h,6h,24h,7d, or a custom range within the last seven days. The 7-day cap matches the default Cloud retention (see Retention). - App ID search and Active Only — narrow the comparison table.
Dashboards refresh roughly once a minute while the page is open.
App ID detail view
Click any App ID in the comparison table to drill into a per-App-ID page with the same KPIs and charts scoped to that single workload. Use this view to confirm whether a project-level spike came from one noisy App ID or is spread across the fleet, and to see that App ID's headroom against the rate limit.
Investigating a spike
A Metrics chart tells you when something changed, not what changed. To go from a spike to a root cause, keep the same App ID and time window and jump to:
- API Logs — filter by App ID and the time window from the chart to read the actual failing requests, methods, status codes, and latencies.
- App Graphs — select the same App ID to see which upstream callers or downstream components were involved during the window.
This pattern — spike on Metrics → request detail in API Logs → topology in App Graphs — covers most incident triage in Catalyst.
Retention
On Catalyst Cloud, metrics are retained for 7 days; logs for 3 days. Both limits are listed in Catalyst Cloud quotas. Paid plans and Catalyst Enterprise increase retention — contact Diagrid if your investigation horizon is longer than the default.
Export to external monitoring
If you already run Datadog, Grafana, New Relic, or any OTLP-compatible backend, you can ship Catalyst telemetry to it instead of (or in addition to) the in-console dashboards.
- Catalyst Cloud — metric dashboards are in-console only today. Distributed traces can be exported by attaching a Dapr
Configurationresource to your App IDs; see Observability settings for the tracing-export workflow. - Catalyst Enterprise Self-Hosted — the platform ships an OpenTelemetry Collector that supports OTLP receivers and exporters for Prometheus Remote Write and OTLP HTTP. See Enterprise Self-Hosted Observability for the collector configuration.
Related
- Observability — the concept model behind metrics, traces, and logs.
- API Logs — per-call detail to pair with a metric spike.
- App Graphs — topology context for a noisy App ID.
- Catalyst Cloud quotas and limits — rate limits and retention.